Business Starts Here
Welcome to the Pulaski County Growth Alliance

We’re here to create a better place to live for current and future residents of Pulaski County by increasing the social, economic, educational, health related and recreational opportunities for all by acting collectively to increase local capacity to respond to local needs.
PCGA Strives to:
• Provide additional and enhanced job opportunities for the residents of Pulaski County;
• Identify and make available educational and training needs for the area’s unemployed/under-employed;
• Provide additional educational/training opportunities and employment opportunities;
• Reduce the need for government assistance and state and federal subsidies;
• Increase local tax revenues;
• Identify and remedy problems impeding growth in Pulaski County; and
• Attract jobs and investment to the area.

Opportunities for Business Growth in Central Missouri
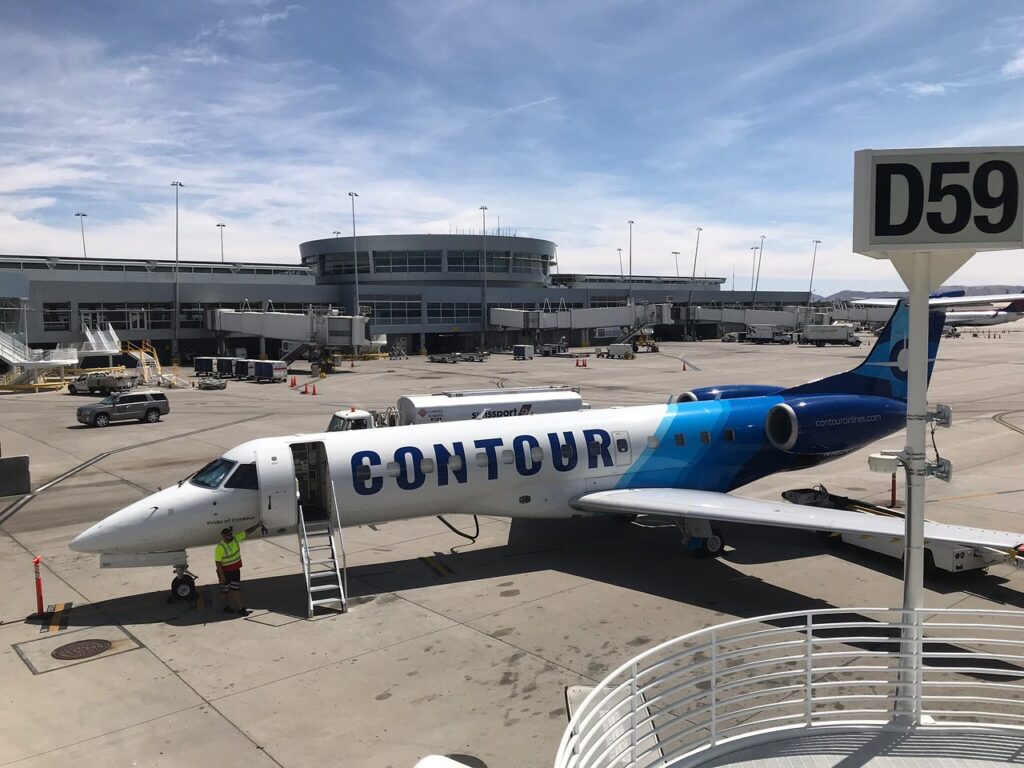
Pulaski County in Central Missouri is a prime location for business relocation, expansion, and development. This Midwest location gives easy transportation access to Interstate 44, and rail service with BNSF. There is commercial air service at Waynesville-St. Robert Regional Airport (TBN) offering daily. Pulaski County is also home to Fort Leonard Wood, which is the U.S. Army’s maneuver support center, and training post for engineer, chemical, and military police personnel.
The business-friendly attitude and laidback lifestyles afford an escape from the hustle and bustle of big city life. You can compete globally without the headaches of that big city life with lower utility costs, low taxes, and a skilled workforce.
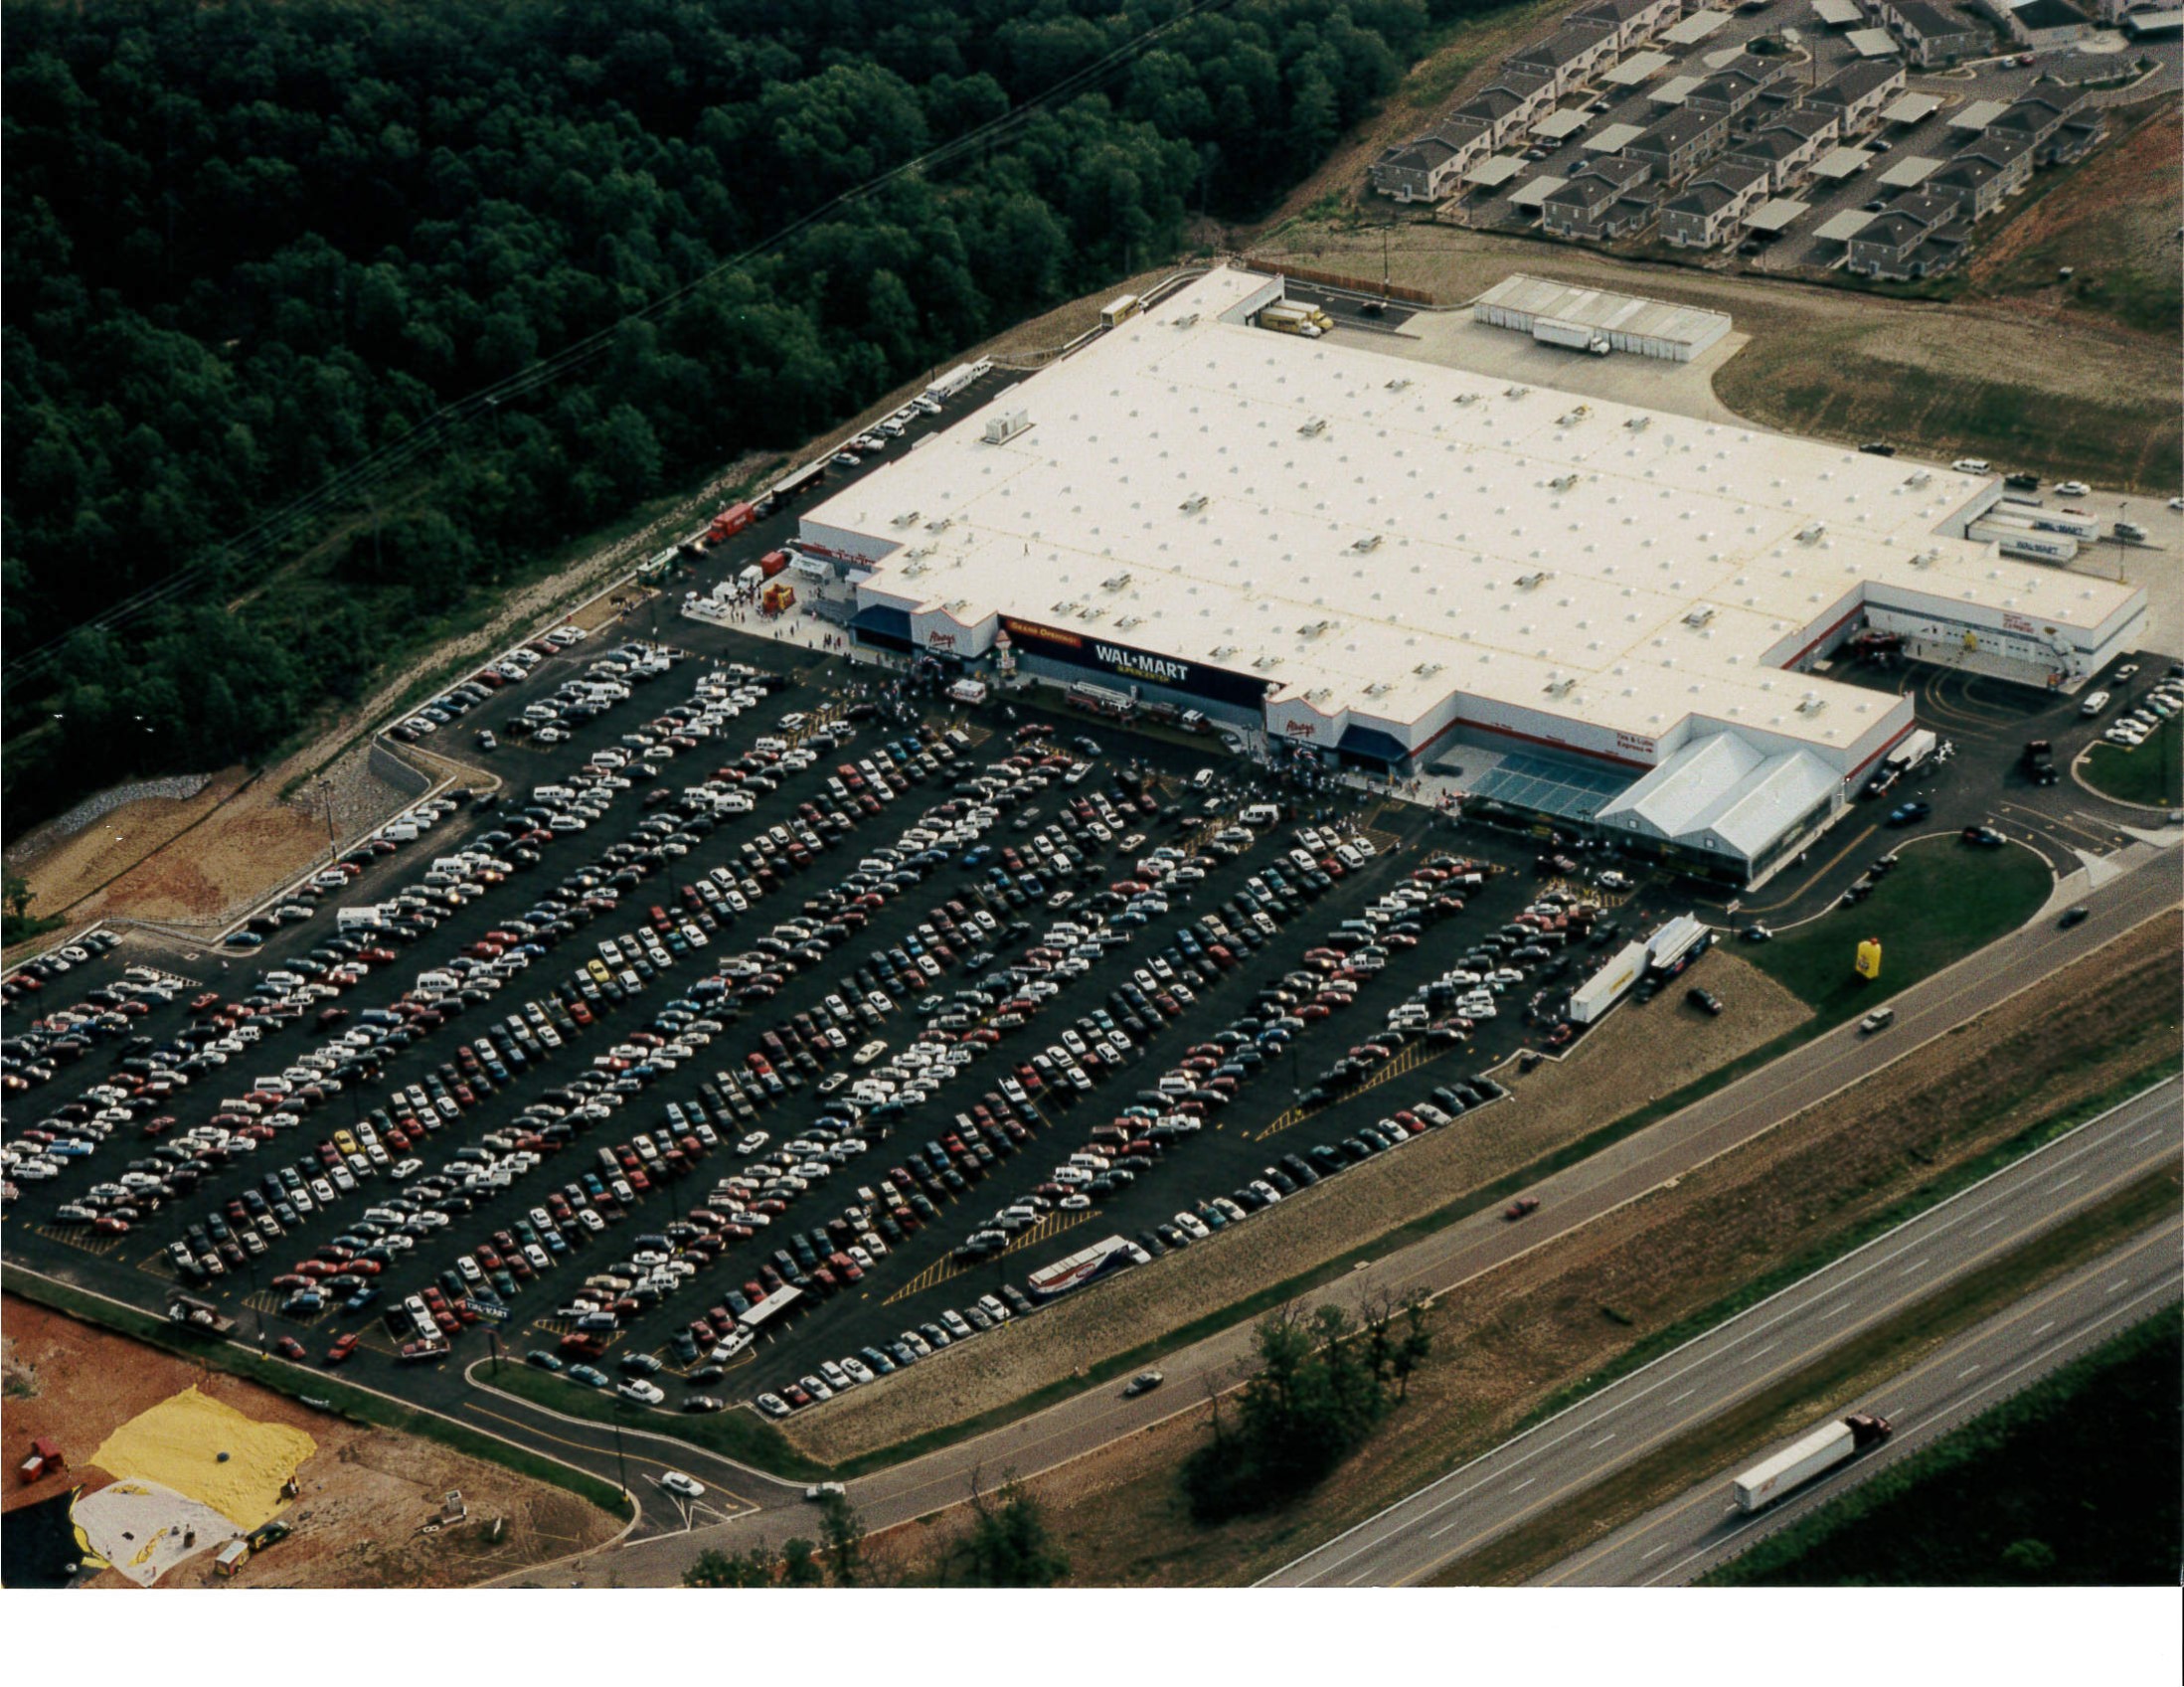
Opportunities exist for manufacturing, retail, and venues, with a strong base of accommodations and restaurants to support. Accommodations generate over 54M in room nights a year, which bring opportunities for developers to invest in activities and attractions to a year-round tourism market to complement the tourism attributes; outdoor activities, Trail of Tears, military history, and Historic Route 66.
Pulaski County, Affordable Quality of Life
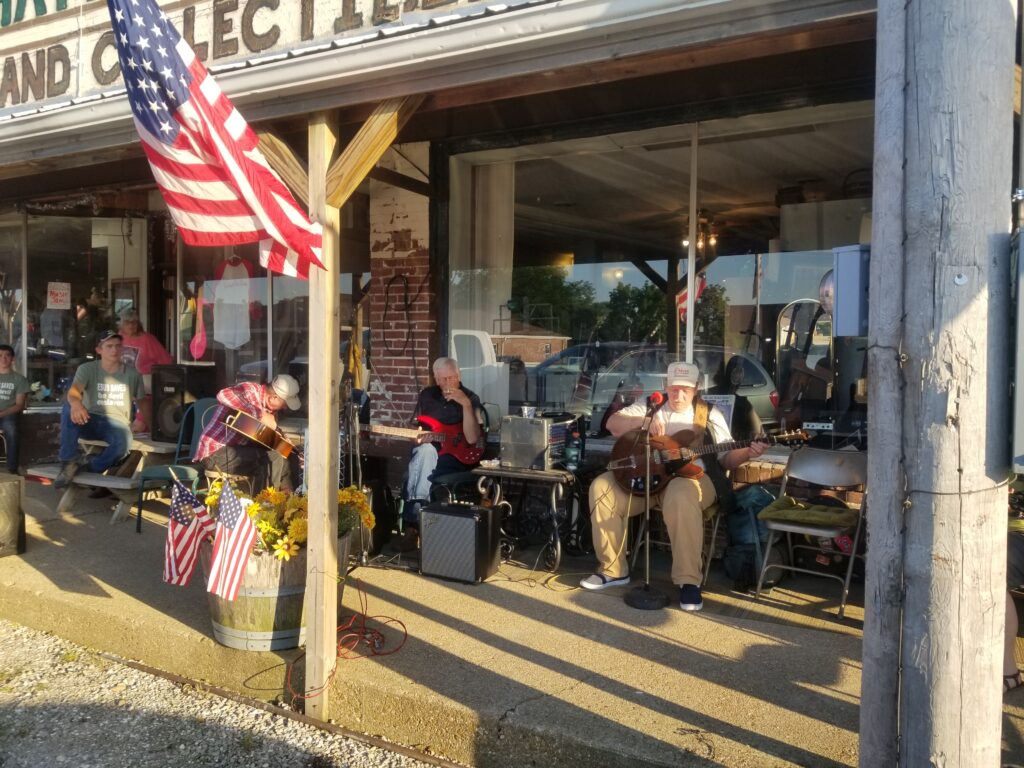
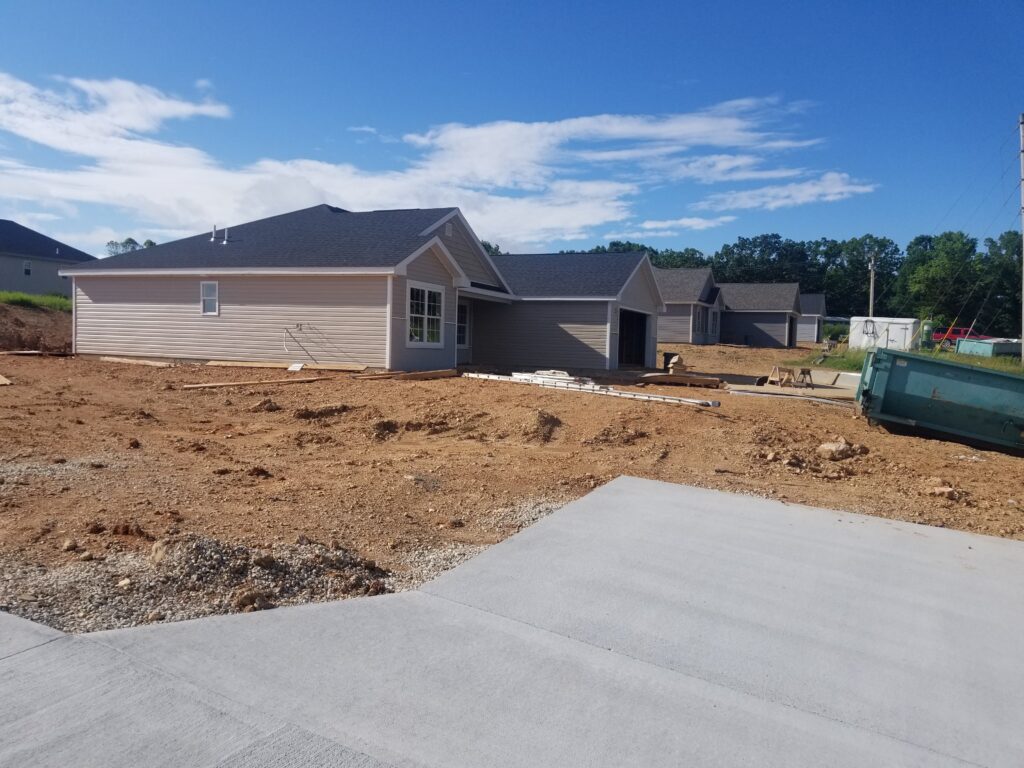
Pulaski County Missouri offers an affordable quality of life while working, and on into retirement. The most recent data from BestPlaces.net, Pulaski County’s median income is $49,604, and the median house price at $158,800. For more information on the housing market visit the Pulaski County Board of Realtors. County-wide activities promote physical fitness; golf, fishing, spelunking, camping, kayaking, running, and cycling. And communities hold events and festivals year-round, for great family fun. To learn more about Pulaski’s tourism and communities located within the county, visit PulaskiCountyUSA.com, Living in Pulaski.


Become Involved
PCGA is overseen by a volunteer group focused on the growth and quality of life throughout Pulaski County Missouri. We welcome all to join in the organizational mission. To learn more about membership with PCGA click below.
Small Business Community Impact Grant
Pulaski County Growth Alliance strives to grow the community and business within Pulaski County. A part of our efforts, we are pleased to announce the availability of 10 small business grants of $500 each to support local small businesses that demonstrate a commitment to community engagement.
Access the full list of requirements and application packet below.
Become Involved
Economic and Social Development
Well-being
Quality of Life
Member Spotlight